The Top 7 Oil & Gas Infographics of 2012
Add bookmark
In this feature Oil & Gas IQ presents the seven most viewed Infographics of 2012.
|
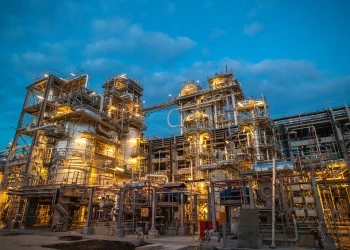
INFOGRAPHIC: The World's Top 10 Super Refineries
If oil is the Black Blood of The Earth, then the word’s 700 refineries are the beating hearts that use that blood to fuel the planet. In 2011, world refining capacity stood at 93 million barrels per day. If the 10 super refineries on this infographic alone were to shutdown at the same time, 8 per cent of global capacity would be lost overnight. Learn more |
|
INFOGRAPHIC: LNG Bunkering: Worldwide Trends 2013 And Beyond
With ECA regulations on fossil fuel emissions coming in to effect in 2015, the world of shipping has turned to liquefied natural gas (LNG) as a greener, cleaner alternative to conventional diesel power. In this detailed infographic, we take a look at some of the stats behind the upcoming transformation of the bunkering world. Learn more |
|
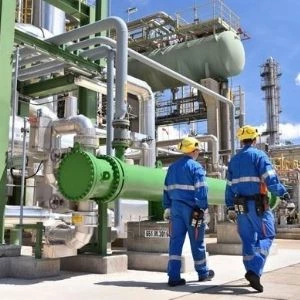
INFOGRAPHIC: Process Safety Blind Spots Exposed!
Improving safety for organisations require mere technological solutions and fixes. Understanding processes and plant interactions are equally important. Oftentimes, "blind spots" are recognized as a significant contributor to a major accident. Are you aware of: The Project Execution Woe, The Safety Assessment Hitch, The Technology Squeeze and six other blind spots? View it now. Learn more |
|
INFOGRAPHIC: Upwardly Mobile? Unleashing Mobile Solutions On The Oil & Gas Sector
In this infographic, we look at how oil and gas has embraced the mobile revolution, the verticals that will benefit most from mobile connectivity and the devices that will be rolled out in the next 12 months Learn more |
|
INFOGRAPHIC: PLAN, DO, CHECK, ACT - Four Steps To Asset Integrity Success
Extending the life of your ageing infrastructure is a common goal for all owner-operators. However, many challenges exist to making this goal a reality. We have summarised the important steps in asset integrity management: PLAN – DO – CHECK – ACT! Download it here now. Learn more |
|
INFOGRAPHIC: How Do You Choose Your Contracting Partners? The Results Are In!
Oil & Gas iQ surveyed its 50,000-strong membership to ascertain how the movers and shakers in the energy world chose their service providers. In this infographic, we lay bare the results of the biggest survey of its kind in the industry. Learn more |
|
INFOGRAPHIC: Top 10 Countries by Reserves, Production, Imports & Exports
The global energy map is changing. As new methods are developed for extracting and new economic models are evolving for commercialising oil and gas, combined with growing areas of demand around the world, those countries and companies who can best leverage these natural resources are well placed to dominate the energy landscape in the short and medium term. In conjunction with the 9th Annual Global R....Read more |
||
-
Looking for a new role? Search thousands of Oil & Gas Jobs here
-
Get the latest Oil & Gas Prices here - updated live
|
Have Your Say Rate this feature and give us your feedback in the comments section below |
____________________________________________________________
Sumit Dutta heads up Marketing at Oil & Gas IQ. Contact him at Twitter or Google Plus